


August 10th, 2021: Natural Gas Continues Bull Market Rally
https://youtu.be/tpdVC5NkZSA 1. To help you understand where we are today, in today’s report, I will be referencing several reports written


https://youtu.be/tpdVC5NkZSA 1. To help you understand where we are today, in today’s report, I will be referencing several reports written
1. To help you understand where we are today, in today’s report, I will be referencing several reports written over the last 6-months, starting with my June 28th, Energy Update, in which I said the recent rally to a new higher high above $3.34 per MMBtu confirmed we were likely in the early stages of a long-term bull market and the average price of Natural Gas would remain high several more years:
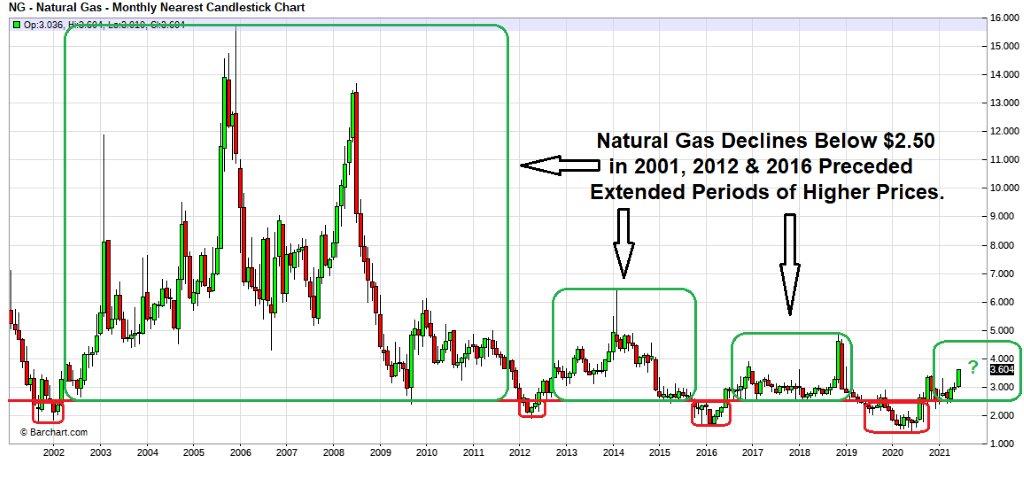
2. And since my last report, Natural Gas extended its rally to a new high at $4.20 per MMBtu, and continues to form a pattern of higher highs and lows similar to 2001, 2012 & 2016 when prices were higher at least 3 years.
The question is with prices above $4.00 per MMBtu is it too late to lock in prices? In today’s report, I will explain why it is not too late, in fact, I believe, it is more important than ever to lock in rates longer-term.
1. In my May 3rd Energy Update, I said our government’s fiscal policies would likely lead to inflation, which would adversely impact your cost of doing business. In response to the corona pandemic our government increased deficit spending at an unprecedented rate, and the FED aggressively implemented quantitative easing, which has flooded the monetary system with cash, and these policies increase the risk of inflation.
2. Since my May 3rd Energy Update, additional spending is now on the horizon, as we are near passing a $1.2 trillion infrastructure bill and the Biden Administration wants another more sweeping $3.5 trillion package that encompasses priorities left out of the narrower measure, including Mr. Biden’s plans for childcare, health care, education, and climate.
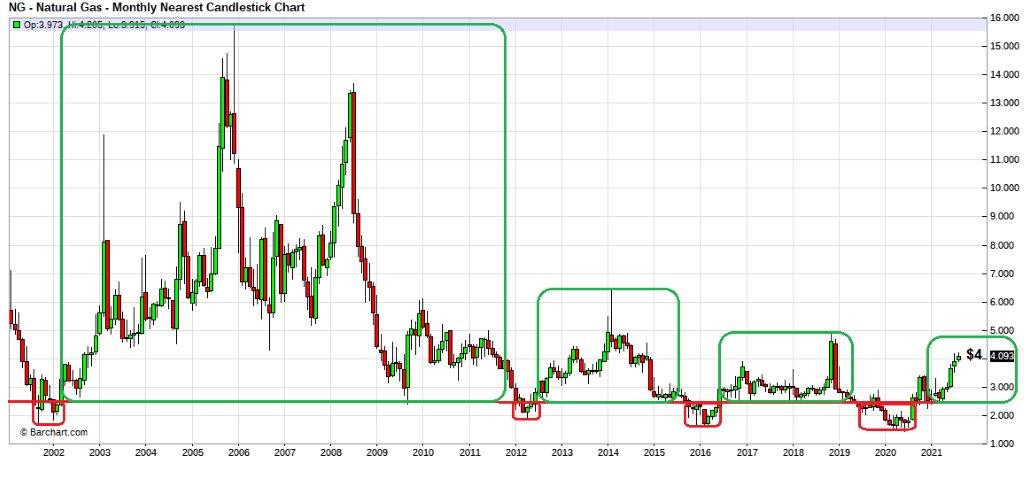
3. Clearly the amount of spending proposed ratchets up the risk of inflation, and as I stated earlier although prices are above $4.00 per MMBtu, I don’t believe it is too late to lock in prices. But to understand why I believe it is not too late, we need to look closely at the previous chart:
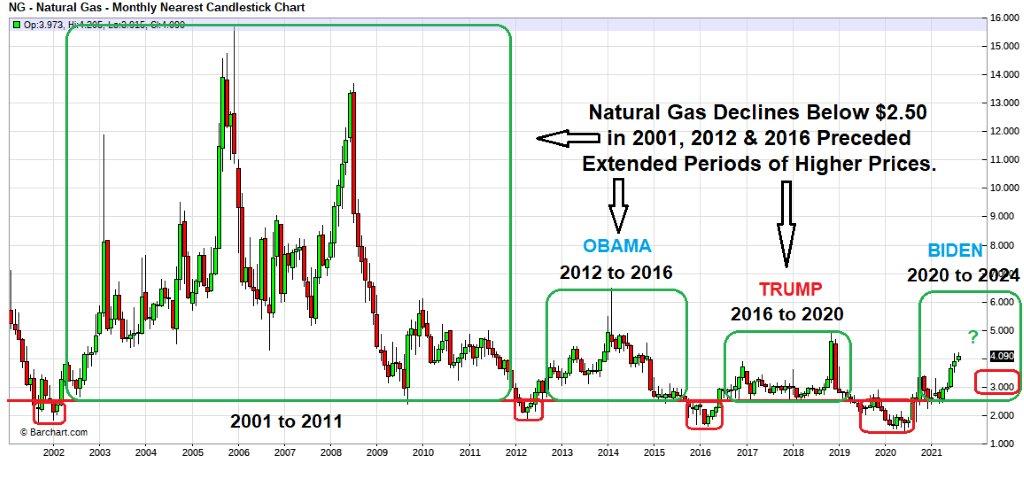
4. When I look at a chart, I want to understand the fundamentals supporting the price action. 2001 to 2011 was prior to horizonal fracking and as you can see, prices were extremely volatile trading from $1.76 to near $16 per MMBtu.
5. In 2012 to 2016, during the Obama administration horizontal fracking increased production, but at the same time they increased regulations on production and prices ranged from $1.90 to $6.49 per MMBtu.
6. In 2016 to 2020, during the Trump administration regulations inhibiting production were lifted and production increased to new records, and prices ranged from $1.44 to $4.93 per MMBtu.
The question is based on the Biden administration present policies what will Natural Gas’s price range be from 2020 to 2024?
1. Only time will tell, but as I wrote in my Feb 2nd Energy Update, early in his administration, President Biden signed an executive order directing the secretary of the Interior Department “to pause on entering into new oil and natural gas leases on public lands and offshore waters to the extent possible” while beginning a “rigorous review” of all existing fossil fuel leases and permitting practices. President Biden also directed federal agencies to “eliminate fossil fuel subsidies as consistent with applicable law.”
2. The Biden Administration similar to the Obama administration has increased fossil fuel regulations, which inhibits production and in conjunction with the amount of spending proposed increases the risk of inflation in all areas of our economy.
3. Over the next 3 years, I don’t believe, we will return to the prices we experienced from 2001 to 2011 prior to horizontal fracking, but it is highly unlikely we will return to the prices experienced during the Trump administration in 2016 to 2020 when regulations were lifted and production increased to new records, and inflation was a non-factor.
4. I believe we will likely return to prices similar to what we experienced during the Obama administration, but prices north of $6.50 per MMBtu are possible. But the good news is if you look closely at the previous chart, you will notice a red circle I placed for prices in 2022 thru 2024.
5. As I explained in previous reports, the good news is Natural Gas is presently experiencing a market phenomenon called “Backwardation”. Backwardation occurs when nearby contracts sell at higher prices than contracts further out, and prices for Natural Gas in the forward markets are trading near $3.00 per MMBtu! I believe three years from now you may look back and realize there was only one cost of doing business you could have stopped increasing, your cost of energy for Natural Gas and Electricity.
Not every client’s risk tolerance and hedging strategy is the same, but the above report will help you put into perspective the risk/reward opportunities. I invite you to call one of our energy analysts to help you plan a hedging strategy appropriate for your situation.
Ray Franklin
Energy Professionals
Senior Commodity Analyst

Don't have one? You can get one by calling us at 855-4-PKIOSK.
Energy Professionals is committed to finding its customers the best possible rates on electricity and natural gas. Tell us your location and service type and our energy manager will connect you to the most competitive offers.
Switching to an alternate supplier is easy. There is no chance of service disruption, and you'll continue with your current utility for energy delivery and emergency service. Take a few minutes to discover your best offers, and enjoy the benefits of retail energy in your home or business.
1. Energy Type
2. Service Type
3. Zip Code
4.Local Company
5.Zone

We believe that knowledge is power. Here’s a free e-book that provides business solutions to reducing energy costs.
Download E-Book Free Energy Audit