


Natural Gas Continues to Rally and May Have Further to Go Before a Significant Pullback
In my April 11th Energy Update, I explained why recent events increased the probability we are returning to a period


In my April 11th Energy Update, I explained why recent events increased the probability we are returning to a period
In my April 11th Energy Update, I explained why recent events increased the probability we are returning to a period similar to 2000 to 2011 characterized by higher Natural Gas prices and extreme volatility.
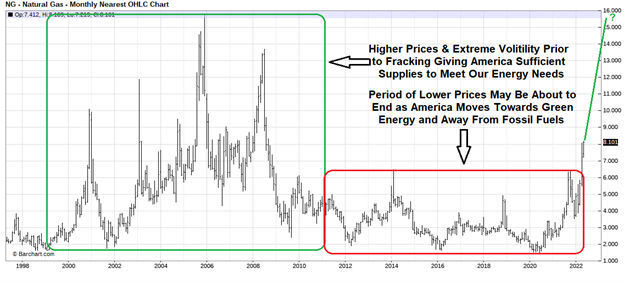
In my Mar 7th Energy Update I said the present administration’s energy policies have led to decreased production and skyrocketing Natural Gas and Gasoline prices, and if we move away from a long-term commitment to fossil fuels we were in danger of returning to the period of higher prices and extreme volatility prior to fracking from 2000 to 2011.
Russia’s invasion of Ukraine clearly impacted the flow of Natural Gas to Europe leading to the most recent spike in energy prices. But as I said in previous reports since the beginning of last year, there was a great risk our energy prices would increase due to the administration’s restrictive energy policies, aggressive fiscal spending, and quantitative easing by the Fed, leading to systemic inflation in the U.S.
All of these factors were in place before Russia invaded Ukraine and with energy prices surging after the invasion many hoped the present administration would at least temporarily respond to surging energy prices and institute less restrictive fossil fuel policies to promote increased production.
But the administration’s budget proposal for 2022/23 contained 11 tax hikes on the Oil and Gas industry, including eliminating tax credits and tax deductions for intangible drilling costs, and low-production wells that enable small producers in the United States to produce Oil. Removing deductions will likely result in lower domestic output and adversely affect the already high Natural Gas and Oil prices. Our government attempted to justify the fossil fuel cuts by saying they were needed to help lower the budget by 4 billion dollars.
But this didn’t make sense when at the same time, they increased the budget deficit by proposing large increases in green energy subsidies including providing other nations with 11 billion dollars to fight climate change—more than 10 times the amount they spent in fiscal 2022, which will increase the budget deficit.
The fact that in the midst of an energy crisis the present administration proposed subsidies for nations outside of the United States to fight climate change while cutting subsidies for fossil fuel production while in the midst of an energy crisis is disheartening and support, why recent events increase the probability we are in danger of returning to a period similar to 2000 to 2011, characterized by higher Natural Gas prices and extreme volatility.
Therefore, as I wrote in my Mar 30th Energy Update, the timing of executing hedges has become paramount to the effectiveness of your energy policy. Those who heeded my recommendations to secure a long-term fixed rate before rates moved higher are paying less than today’s available rates. If you had not already secured a long-term fixed rate, I thought you might have an opportunity to do so in during this year spring shoulder period between winter heating and summer cooling when demand for Natural Gas and Electricity decreased.
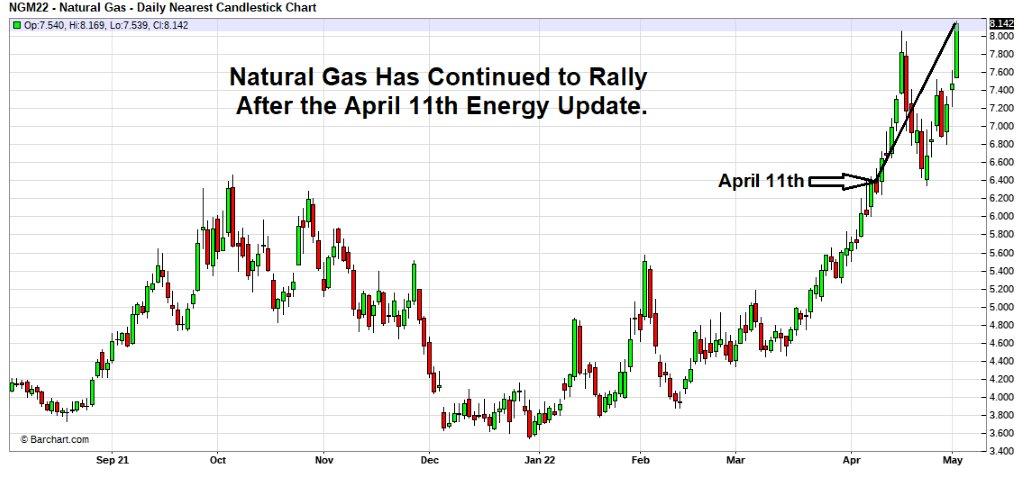
But as you can see Natural Gas has continued to rally since the April 11th Energy Update and thus far is not showing any sign of a significant pull back:
But by looking at what took place during the period of high prices and extreme volatility from 2000 to 2011, we may have a clue of what might be about to take place in today’s market. Energy markets follow cyclical patterns and if you look at the following chart you will notice the four rallies from 2000 to 2011 from their initial lows to ultimate highs took anywhere from 17 to 27 months.
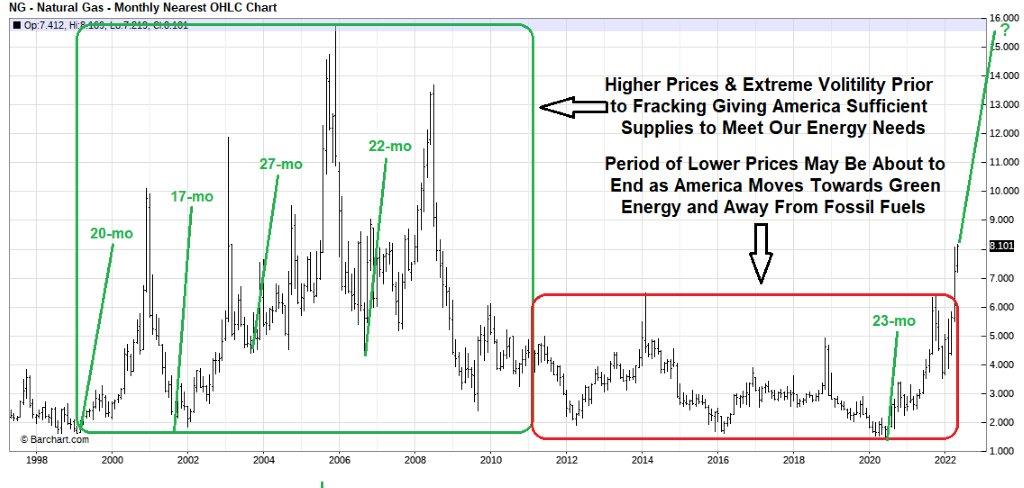
Natural Gas started its present rally 23-months ago in June 2020: therefore; we could be nearing the end of the present cyclical rally, but as you can see from the above chart the last part of the rally can be extremely explosive. Therefore, if you have agreements expiring within the next few months you may consider going longer-term since prices in the forward markets are lower from 2023 thru 2026:
Month | 2022 | 2023 | 2024 | 2025 | 2026 |
Jan | 8.27 | 5.44 | 4.76 | 4.58 | |
Feb | 7.98 | 5.23 | 4.62 | 4.47 | |
Mar | 6.78 | 4.84 | 4.28 | 4.21 | |
Apr | 4.97 | 4.1 | 3.69 | 3.72 | |
May | 4.79 | 4.03 | 3.64 | 3.7 | |
Jun | 7.95 | 4.83 | 3.92 | 3.7 | 3.76 |
Jul | 8.02 | 4.87 | 4.1 | 3.76 | 3.83 |
Aug | 8.04 | 4.87 | 4.01 | 3.79 | 3.84 |
Sep | 7.96 | 4.85 | 3.99 | 3.78 | 3.84 |
Oct | 7.96 | 4.89 | 4.06 | 3.85 | 3.89 |
Nov | 8.02 | 5.04 | 4.23 | 4.04 | 4.08 |
Dec | 8.17 | 5.3 | 4.63 | 4.39 | 4.43 |
AVG | 8.02 | 5.62 | 4.38 | 4.03 | 4.03 |
Also, in some cases our consultants can help you secure blend and extend agreements to take advantage of the expected sharp pullback when it finally comes. The bottom line is we are living in a period of great uncertainty, and we are here to help you navigate these perilous times
Not every client’s risk tolerance and hedging strategy are the same, but the above report will help you put into perspective the risk/reward opportunities. I invite you to call one of our energy analysts to help you plan a hedging strategy appropriate for your situation.
Ray Franklin
Energy Professionals
Senior Commodity Analyst

Don't have one? You can get one by calling us at 855-4-PKIOSK.
Energy Professionals is committed to finding its customers the best possible rates on electricity and natural gas. Tell us your location and service type and our energy manager will connect you to the most competitive offers.
Switching to an alternate supplier is easy. There is no chance of service disruption, and you'll continue with your current utility for energy delivery and emergency service. Take a few minutes to discover your best offers, and enjoy the benefits of retail energy in your home or business.
1. Energy Type
2. Service Type
3. Zip Code
4.Local Company
5.Zone

We believe that knowledge is power. Here’s a free e-book that provides business solutions to reducing energy costs.
Download E-Book Free Energy Audit