Natural Gas Declines 60% from 2022 High Tests Long-Term Support Near 2011 to 2021 Breakout
In my June 20th Energy Update, I said after Freeport LNG announced the damage at its plant would keep it


In my June 20th Energy Update, I said after Freeport LNG announced the damage at its plant would keep it
In my June 20th Energy Update, I said after Freeport LNG announced the damage at its plant would keep it fully offline until late September with partial operation returning thru year-end. Natural Gas immediately breached the 40-day moving average and after briefly rallying the next day to test this key moving average it resumed its decline to close the week below $7 per MMBtu.
Last week, Natural Gas continued to decline, and Friday reached a low of $6.02 per MMBtu:
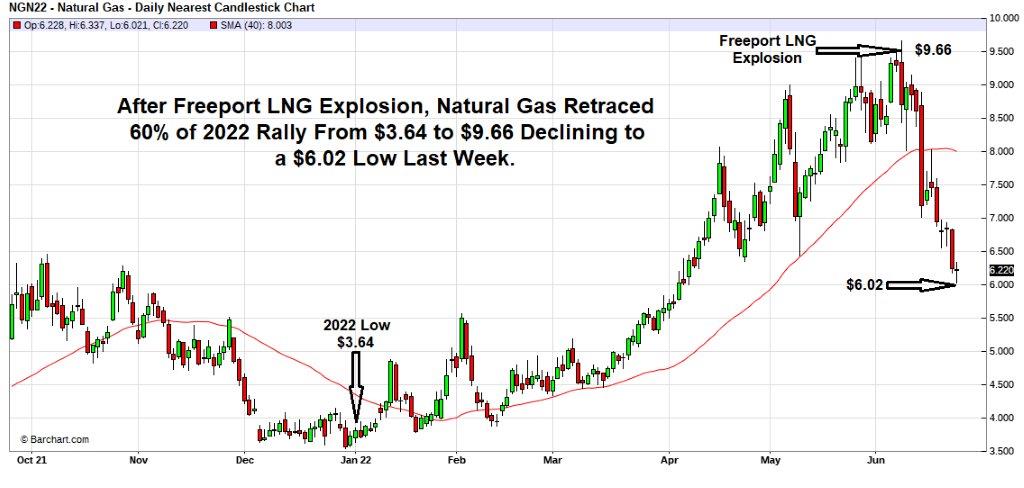
Last week’s decline to $6.02 was close to a full Fibonacci retracement of 61.8% from Natural Gas’s 2022 low of $3.64 to its $9.66 high reached just prior to the Freeport LNG explosion. Fibonacci retracements are followed by technical traders because they can be support levels, and considering the risk factors summarized in the June 20th Energy Update, a rally from this level would not be surprising.
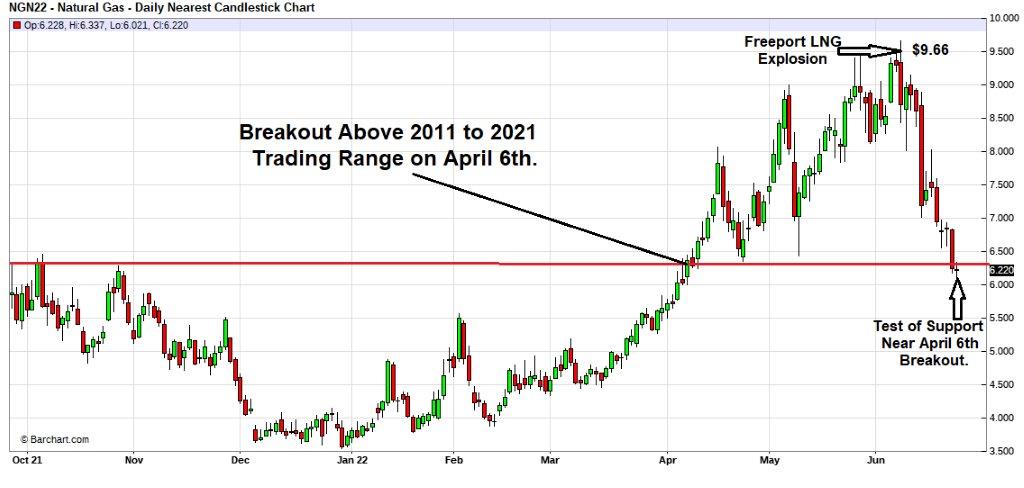
Also, it is important to note from a long-term perspective Natural Gas’s recent pullback is testing the April 6th breakout from its 2011 to 2021 trading range:
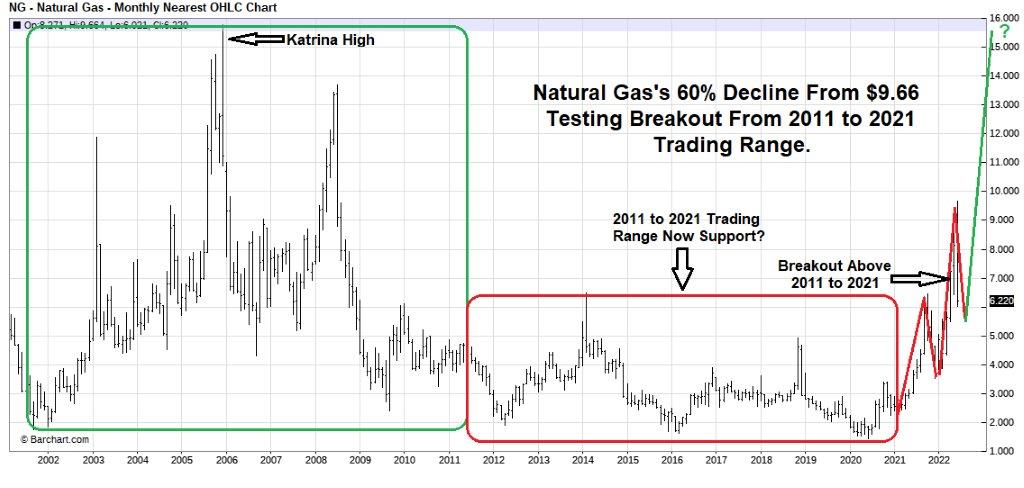
When a market breaks out from a long-term base, what previously was resistance often becomes support. Therefore, if you look closely at Natural Gas’s short-term chart, Natural Gas’s recent 60% decline from its $9.66 high is testing 2011 to 2021 long-term support near its April 6th breakout:
As I explained in previous reports, Natural Gas prices are lower in the forward markets from 2023 thru 2026; therefore; if you have agreements expiring within the next few months, I recommend taking advantage of Natural Gas’s recent decline in domestic Natural Gas prices caused by the Freeport LNG explosion and secure longer-term agreements including lower prices from 2023 thru 2026:
Month | 2022 | 2023 | 2024 | 2025 | 2026 |
Jan |
| 6.62 | 5.29 | 5.15 | 5.08 |
Feb |
| 6.42 | 5.07 | 5.06 | 4.94 |
Mar |
| 5.81 | 4.78 | 4.76 | 4.67 |
Apr |
| 4.67 | 4.26 | 4.21 | 4.13 |
May |
| 4.89 | 4.25 | 4.16 | 4.11 |
Jun |
| 4.57 | 4.31 | 4.23 | 4.17 |
Jul | 6.27 | 4.71 | 4.38 | 4.29 | 4.23 |
Aug | 6.32 | 4.69 | 4.38 | 4.31 | 4.25 |
Sep | 6.32 | 4.66 | 4.37 | 4.31 | 4.25 |
Oct | 6.33 | 4.72 | 4.44 | 4.37 | 4.31 |
Nov | 6.41 | 4.85 | 4.63 | 4.54 | 4.49 |
Dec | 6.53 | 5.15 | 5.01 | 4.91 | 4.85 |
AVG | 6.36 | 5.15 | 4.59 | 4.53 | 4.46 |
Also, as I said in recent reports, when appropriate our consultants will also help you secure blend and extend agreements to take advantage of an even sharper longer-term pullback if and when it finally comes. The bottom line is we are living in a period of great uncertainty, and we are here to help you navigate these perilous times
Not every client’s risk tolerance and hedging strategy are the same, but the above report will help you put into perspective the risk/reward opportunities. I invite you to call one of our energy analysts to help you plan a hedging strategy appropriate for your situation.
Ray Franklin
Energy Professionals
Senior Commodity Analyst

Don't have one? You can get one by calling us at 855-4-PKIOSK.
Energy Professionals is committed to finding its customers the best possible rates on electricity and natural gas. Tell us your location and service type and our energy manager will connect you to the most competitive offers.
Switching to an alternate supplier is easy. There is no chance of service disruption, and you'll continue with your current utility for energy delivery and emergency service. Take a few minutes to discover your best offers, and enjoy the benefits of retail energy in your home or business.
1. Energy Type
2. Service Type
3. Zip Code
4.Local Company
5.Zone


We believe that knowledge is power. Here’s a free e-book that provides business solutions to reducing energy costs.
Download E-Book Free Energy Audit