


Natural Gas Prices Increasing After Reaching October Seasonal Low
In my Oct 17th Energy Update, I summarized what happened to Europe’s Natural Gas prices after the European Commission introduced


In my Oct 17th Energy Update, I summarized what happened to Europe’s Natural Gas prices after the European Commission introduced
In my Oct 17th Energy Update, I summarized what happened to Europe’s Natural Gas prices after the European Commission introduced the European Green Deal in December 2019, and the potential consequences of America following similar policies.
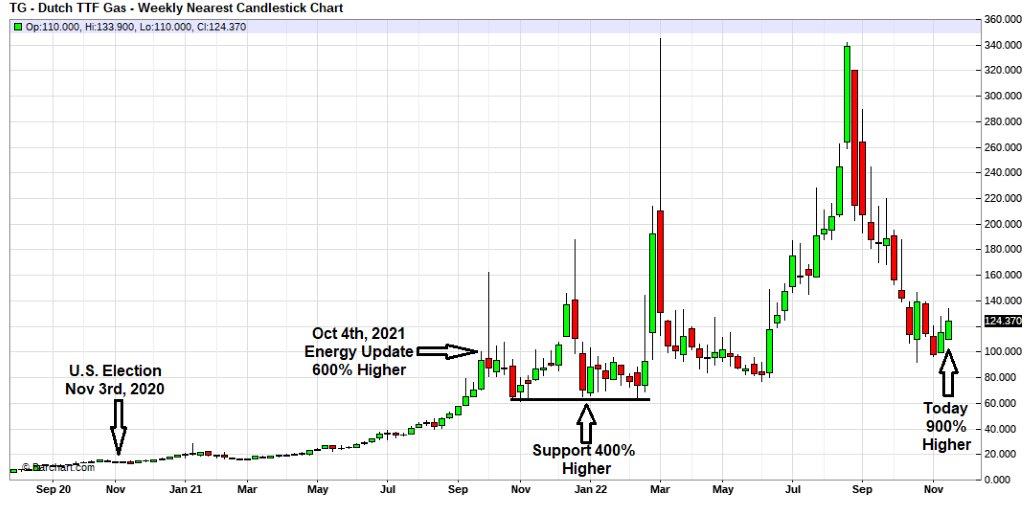
In my Oct 4th, 2021, Energy Update, I explained why I believed the risk of higher Natural Gas and Electricity prices were increasing short-term and long-term. Green energy policies implemented in Europe over the last year resulted in their Natural Gas supplies being at a 10-year low last year as they entered their winter heating season.
They imported as much Liquefied Natural Gas (LNG) as possible to make up the gap with U.S. Liquefied Natural Gas exports hitting record levels to help them make up the deficit. And although unseasonably mild fall weather this year in Europe has helped Europe rebuild their supplies, the long-term impact of the European Commission policies based on the politics of Climate Change has led to less investment capital for Europe’s energy sector, which is not abating, it is becoming more entrenched here and abroad.
The graph below shows what has happened to Europe’s Natural Gas prices due to their Green Deal policies. From Nov 3rd, 2020, to Oct 4th, 2021, their Natural Gas prices increased by 600% and are presently 900% higher since Nov 3rd, 2020:
In my Oct 17th Energy Update, I also pointed out America has instituted policies similar to Europe that need to be factored into our energy strategies over the next three years.
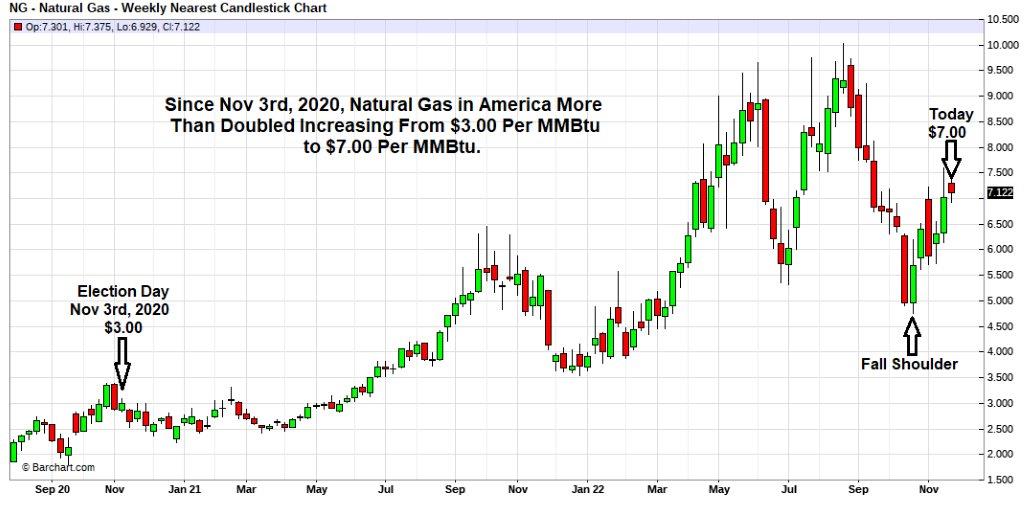
The impact of the restrictive fossil fuel policies by our present administration has greatly impacted the price of America’s Natural Gas since President Biden was elected Nov 3rd, 2020, with Natural Gas increasing from $3.00 per MMBtu to $7.00 today:
Our present administration’s commitment to green energy increases the probability the next three years will be characterized by wild swings in energy prices, and securing fixed rates when prices pull back will be in your best interest.
In my Oct 17th Energy Update, I said Natural Gas’s price decline in October was primarily based on 2 factors:
And in the above chart the Fall Shoulder low was reached as anticipated in late October, and prices are now moving higher as we enter the Winter heating season.
3 factors will support higher prices in the United States:
Based on the above observations, Natural Gas and Electricity prices will likely increase in the long-term, and short-term pullbacks should be considered buying opportunities. The timing of entry, and most effective term, (length of contract), for your hedge is based on a wide variety of factors, but the 2 most important are your risk tolerance, and the shape of the pricing curve in the forward markets.
As I explained in previous reports, Natural Gas prices are lower in the forward markets from 2023 through 2026; and we recommend securing longer-term agreements that include the lower prices from 2023 through 2026.
Month | 2022 | 2023 | 2024 | 2025 | 2026 |
Jan |
| 7.14 | 6.14 | 5.35 | 5.29 |
Feb |
| 6.97 | 5.83 | 5.15 | 5.09 |
Mar |
| 6.25 | 5.12 | 4.75 | 4.69 |
Apr |
| 5.11 | 4.23 | 4.14 | 4.08 |
May |
| 5.05 | 4.15 | 4.11 | 4.05 |
Jun |
| 5.14 | 4.22 | 4.19 | 4.12 |
Jul |
| 5.23 | 4.29 | 4.29 | 4.21 |
Aug |
| 5.24 | 4.31 | 4.31 | 4.25 |
Sep |
| 5.17 | 4.27 | 4.31 | 4.24 |
Oct |
| 5.24 | 4.35 | 4.39 | 4.32 |
Nov |
| 5.51 | 4.69 | 4.71 | 4.65 |
Dec |
| 5.89 | 5.12 | 5.09 | 5.02 |
AVG | 6.64 | 5.66 | 4.73 | 4.57 | 4.51 |
And as explained in recent reports, when appropriate our consultants will also help you secure blend and extend agreements to take advantage of an even sharper longer-term pullback if and when it finally comes. The bottom line is we are living in a period of great uncertainty, and we are here to help you navigate these perilous times
Not every client’s risk tolerance and hedging strategy are the same, but the above report will help you put into perspective the risk/reward opportunities. I invite you to call one of our energy analysts to help you plan a hedging strategy appropriate for your situation.
Ray Franklin
Energy Professionals
Senior Commodity Analyst

Don't have one? You can get one by calling us at 855-4-PKIOSK.
Energy Professionals is committed to finding its customers the best possible rates on electricity and natural gas. Tell us your location and service type and our energy manager will connect you to the most competitive offers.
Switching to an alternate supplier is easy. There is no chance of service disruption, and you'll continue with your current utility for energy delivery and emergency service. Take a few minutes to discover your best offers, and enjoy the benefits of retail energy in your home or business.
1. Energy Type
2. Service Type
3. Zip Code
4.Local Company
5.Zone

We believe that knowledge is power. Here’s a free e-book that provides business solutions to reducing energy costs.
Download E-Book Free Energy Audit